 Also available to buy in a beautiful limited edition paperback and eBook.
This work is licensed under a Creative Commons Attribution 4.0 International License.
Web project managers like to say that the sooner you begin coding, the later you finish. Hearing this from a project manager, you might get the impression that the only reason for pre-production is to ensure that deadlines are met. Whether or not you agree, this approach doesn’t focus on the real essence of planning: the pre-production phase should ensure that your web app is a success, irrespective of deadlines.
“If you start with a deeply flawed design, usability testing will diagnose many of the problems, but won't necessarily point to a cure. Iteration won’t get you to a great design.”
Kim Goodwin, Cooper
Iterative web development means that we don’t have to get everything right straight away. We can add and fine-tune features over time. It is more difficult, however, to iterate the basic foundations on which the app is based: the key problem that it’s solving, the underlying business model and the validity of the target audience. Of course these can be changed, but not without significant cost which can endanger the viability of the project.
Over the next five chapters, this section concentrates on two of these fundamental questions: what does your target customer look like; and how is your app going to make money?
Researching the size and shape of your market sounds like a theoretical exercise that’s only useful for those seeking investment, but it’s a critical step in influencing the direction of your app.
Is your market large enough to support an app funded by advertising? Is it niche enough to generate word-of-mouth recommendations and community loyalty? Is the market in countries that make it worthwhile to support translated versions and foreign currency support? Will your market still be around in twelve months’ time?
Luckily for us, and thanks in part to our increasing apathy towards personal data privacy, there are more research tools and data freely available than ever before.
Let’s assume that we’re building an app that automatically analyses the design of a website, not the code or the content, but the graphical look-and-feel. It can extract and analyse the typographical hierarchy and adherence to micro-typography rules, the percentage and distribution of white space, the colour palette and consistency of layout. Not only will it give us a report, it will highlight potential issues and enable us to tweak elements to preview how our website would look with superior typography, a consistent grid system, or a more professional colour palette.
Do people want this tool? Will it be used? The simplest and most widely propagated advice for market validation is to simply ask yourself, “Do I need this? Would I use this?” Software built to address your problems will almost certainly also address those of others; it’s rare for anyone to face a unique dilemma.
Even so, gut reasoning isn’t enough. Without quantifying your market, it’s difficult to make informed decisions about pricing, promotion, interface design, architectural scalability and other important elements of your app.
Seeking out competition is an easy way to start, but we don’t necessarily need to identify existing competitors to prove that we’re building something that people want. If we can’t find competitors, we can alternatively look for people blogging about problems that the app solves, or discover if people search for topics related to the app domain.

Google search results for topics related to our app hint at a viable market
In the case of our example app, a simple Google search doesn’t return any direct competitors, but a similar and fairly active personal design critiquing service is highlighted. This is great news for us, containing the best of both worlds: no direct competition, plus validation that the market exists for such a service.
Data from the Google AdWords Keyword Tool1 supports this assertion: a significant number of people (at least 60,500) are searching for topics related to the app. More importantly, the relatively high cost per click (CPC) for these topics demonstrates that companies, which we presume are offering related services or products, are willing to pay top dollar to attract customers, so the market is potentially lucrative.
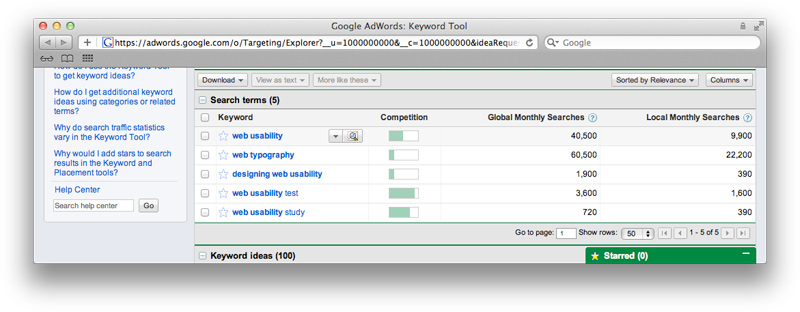
Google AdWords Keyword Tool results show a potentially lucrative market
There are two simple ways to measure the size of a market: in monetary terms (“the market is worth $3 billion”) or potential customer base (“2 million people”).
The market dollar size is the more difficult to estimate, and it is normally used after you’ve started to generate revenue, so that you can calculate your share of the market monetarily. Nonetheless, if you’re eager to get some idea of potential revenue, the Hoovers2 website tracks the sales revenue from published company reports, which are displayed in the free search results. If you can find companies that offer services or products similar to that of your app, it’s a decent yardstick.

Company results from the Hoovers website allow us to see how well companies in our market are faring
Along similar lines, industry market research reports by companies such as eMarketer3 or Forrester4 provide professionally researched statistics on market size, but often cost hundreds of dollars. Although these supply accurate data and expert analysis, they are impractically priced for most web start-ups.

A report relevant to our app is available on the emarketer.com website
A more informal approach is to use social networks to estimate the size of a customer base.
Twitter is a great place to start because a significant percentage of people use it (13% of online adults in the US. as of May 20115), professional interests can be identified and it’s searchable. Although Twitter Search doesn’t offer a method for easily searching user biographies, various third-party apps do. Unconvinced by the completeness of third-party databases, I prefer the simpler approach of using Google to search Twitter biographies (replace topic with a subject relevant to your app):
site:twitter.com -inurl:favorites -inurl:lists intext:bio * typography
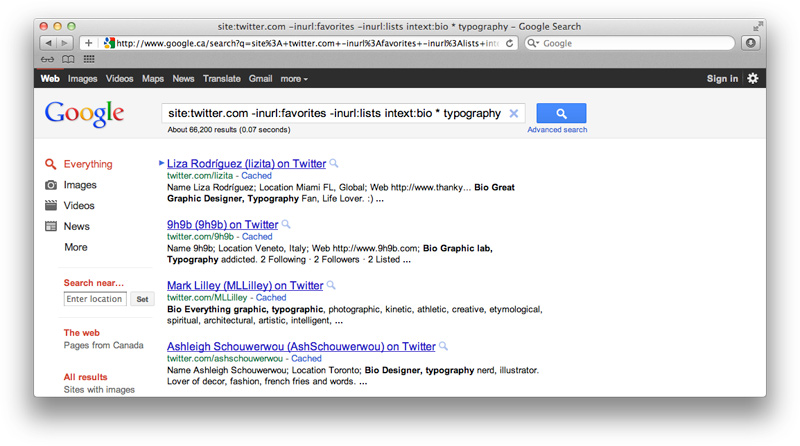
Google search results for Twitter biographies
The number of Twitter results is only an estimate, but it is an approximate measurement that you can use to compare different topics. What we really need are a few more numbers, so that we can make a more informed estimate of the size of our market.
The LinkedIn advanced search6 provides a useful way of searching job titles. In our case, we want to identify how many people might use the web design improvement tool. A search for the title of web manager – people in charge of websites, a large constituent of our target customers – returns 83,370 results.
We now have three figures: 60,500 people search Google monthly for a topic related to our web app; 70,200 people on Twitter have an interest in part of what our app addresses; and 83,370 people on LinkedIn may fulfil duties that the app would assist with.
Let’s conservatively estimate our market size, based on this range of figures, to be about 50,000 people. We don’t need to be accurate for this information to be useful: we can be fairly sure from these numbers that our market size isn’t 100 people or 1 million people. If we aim to initially capture 1% of the market, that’s 500 customers. We can use this later to guide pricing and other decisions.
Why one per cent of the market? The app will exist in a competitive market. Even though there are no feature-for-feature competitors, there are numerous tried and tested alternatives for improving design: hire a graphic designer or user experience expert, perform a user survey or use website analytics. In a highly fragmented market it’s difficult to capture market share.
Should your app exist in a more consolidated market, for example, email readers or search engines, you’ll have a tougher fight on your hands to establish a presence against well-known entrenched competitors. On the flip side, a successful app can more easily capture a larger market share in the tens of per cent.
To check that the market will still be valid in future, the Google Insights for Search tool7 can be used to identify trends in interest. The example below reveals a rapidly growing interest in typography within the Internet category. This is a good sign for the future of our example app.

Growth in interest in typography shown by the Google Insights for Search tool
Once you’re reasonably confident that there’s a valid market waiting for your app, it’s time to find out more about it.
The LinkedIn search results that we used earlier are also segmented by country. This gives us an idea of where our target customers live and work.

Breakdown of LinkedIn web managers by country
Take care with this approach. If your app targets a generic subject, such as shoes, your initial results might highlight a peak US demographic, but this data may be better combined with searches for chaussures, zapatos and other translations.
Additional market segmentation can be performed using Facebook. Follow the website instructions to create a new Facebook ad – don’t worry, there’s no need to actually create or pay for one. Once on the page where you create an advert8, scroll down past the first few advert text fields to the Targeting section.
You can specify country, city, age, sex, relationship status, interest and education level. As you enter data into each field, the Estimated Reach (number of Facebook users) automatically updates.
Start near the bottom and enter topics related to your app. Be as specific as possible. The estimated reach on the right will update to give you the total number of people on Facebook who might be interested in your app.

Performing informal market research with the Facebook Ads tool
Specify a variety of locations, age ranges, sexes and relationships statuses. Each time, record the new estimated reach in a spreadsheet or text file. We’ve already estimated the market size so we’re not interested in the absolute numbers but, rather, the demographic split of the audience. Once you’ve recorded a range of demographic data, calculate or plot the percentages.

Facebook statistics for our app
In the case of our design analysis app, over half of the target market is in the 22–31 year old age bracket, more than 75% live in North America, almost half are married, and women outnumber men.
As with LinkedIn, the numbers are influenced by the popularity of Facebook within each age range, penetration within each country, and the language used to match interests. Keep these biases in mind throughout your analysis.
Once you have an overview of your market, combine permutations of the main demographics to identify significant specific segments of your user base. For example, we can determine that 5% of our target customers are 22–31-year-old, college educated, married women in the US. Such segments represent specific types of users who should be regularly taken into account in critical project decisions regarding app features, marketing, pricing and design. More on that in the next chapter.
Data is power. Social networking websites and public search data allow us to perform rudimentary market research quickly and at no cost. The results can challenge the validity of the app and provide quantifiable data on which to base decisions that influence our chances of success.
At this point, you should be able to answer the following questions:
This work is licensed under a Creative Commons Attribution 4.0 International License.